The Myth of Brand Loyalty - how data reveals what’s truly driving consumer choice

When we think of brand loyalty, we often picture people sticking with their favorite labels out of some emotional attachment or even a sense of identity. But how much of that is true?
As it turns out, not much. Advances in decision science are showing that consumer choices are more influenced by pattern recognition, availability, and intent rather than pure brand loyalty.
Take Porsche as an example. While the logo might symbolize status or inclusion, it’s unlikely Porsche owners would all move to an electric Taycan because it’s still a Porsche.
These owners are in love with the 911 because it aligns with who they are and how they see themselves. The brand simply benefits from the alignment of the driver and car's characteristics and attributes.

This reveals a hidden truth: it’s not about the brand itself, but about what the brand’s products represent at a deeper level.
So, how do brands find out what their customers truly want?
Enter tools like FELIX, which uses graph-based decision science to reveal hidden connections between products and consumer behavior.
A real-world example of this is the launch of a super-premium ‘wet’ Mac & Cheese. Data analysis showed that demand existed in unexpected places. Instead of chasing crowded markets, FELIX pinpointed locations and linked products that aligned with the brand's target consumer base. This led to a successful product launch in previously overlooked areas, despite assumptions about market demand.
Let’s move to more relevant examples we all can appreciate more directly. Decisions are made in large part based on intent, pattern recognition, friction and an outcome that is aligned with the decision maker’s characteristics, attributes and criteria.
What does this mean? What is ‘criteria’? That seems very…vague.
Not at all. It is in fact specific to the user. Criteria can be substituted with the word ‘intent’. What is the consumer’s intent? But don’t focus too heavily on this one thing. Again, decisions are made bases on pattern recognition against intent (what does the person seek as a goal or an outcome), friction (how hard is it to find or identify the thing that aligns with them best), and their unique characteristics and attributes.
Let’s look at a real-world example which illustrates the economic impact of embracing an evolved model. Before we do, let’s point out that in antiquity maps were largely just ‘directionally’ correct because there was such a significant body if missing data, so the map makers filled it in with what they believed. And, for what they generally knew, distances were off, by a lot. These errors were due to the earth being a sphere instead of being flat and that difference must be part of the math to get an accurate determination of distance.
Enough history. Let’s go shopping.
A new super premium ‘wet’ Mac & Cheese product was introduced into several targeted markets in the Midwestern United States. Fingerprinting data from the physical channels was used to inform elements of the digital launch.
Wet Mac & Cheese is commonly associated with ‘Velveeta’. There are very few ‘wet’ premium Mac & Cheese products on the market. So, this means that there is not a market for wet super premium Mac & Cheese. Empty category, no demand. Crowded category, lots of demand.
Follow the demand?
Not necessarily. Crowded categories mean Paradox of Choice for the consumer and smaller share for brands at a higher acquisition and retention cost. Running to the perceived trend is a strategy, just not always the best one.
In this case, the customer segment which aligned with this product were already customers who frequently bought other products in a variety of other non-related categories, and had some specific characteristics, attributes and criteria which using normal methods of analysis were totally invisible.
Decision Arts’ fingerprinting found the commonalities and invisible linkages in the data FELIX ingested and analyzed. Specifically, which other products the Mac & Cheese p_Key score overlapped with, and which customer’s p_Key scores overlapped with both.
Fingerprinting also identified where these customers were most prevalent in the retailer’s chain of locations and which ‘anchor products’ had the strongest bond to the new Mac & Cheese.
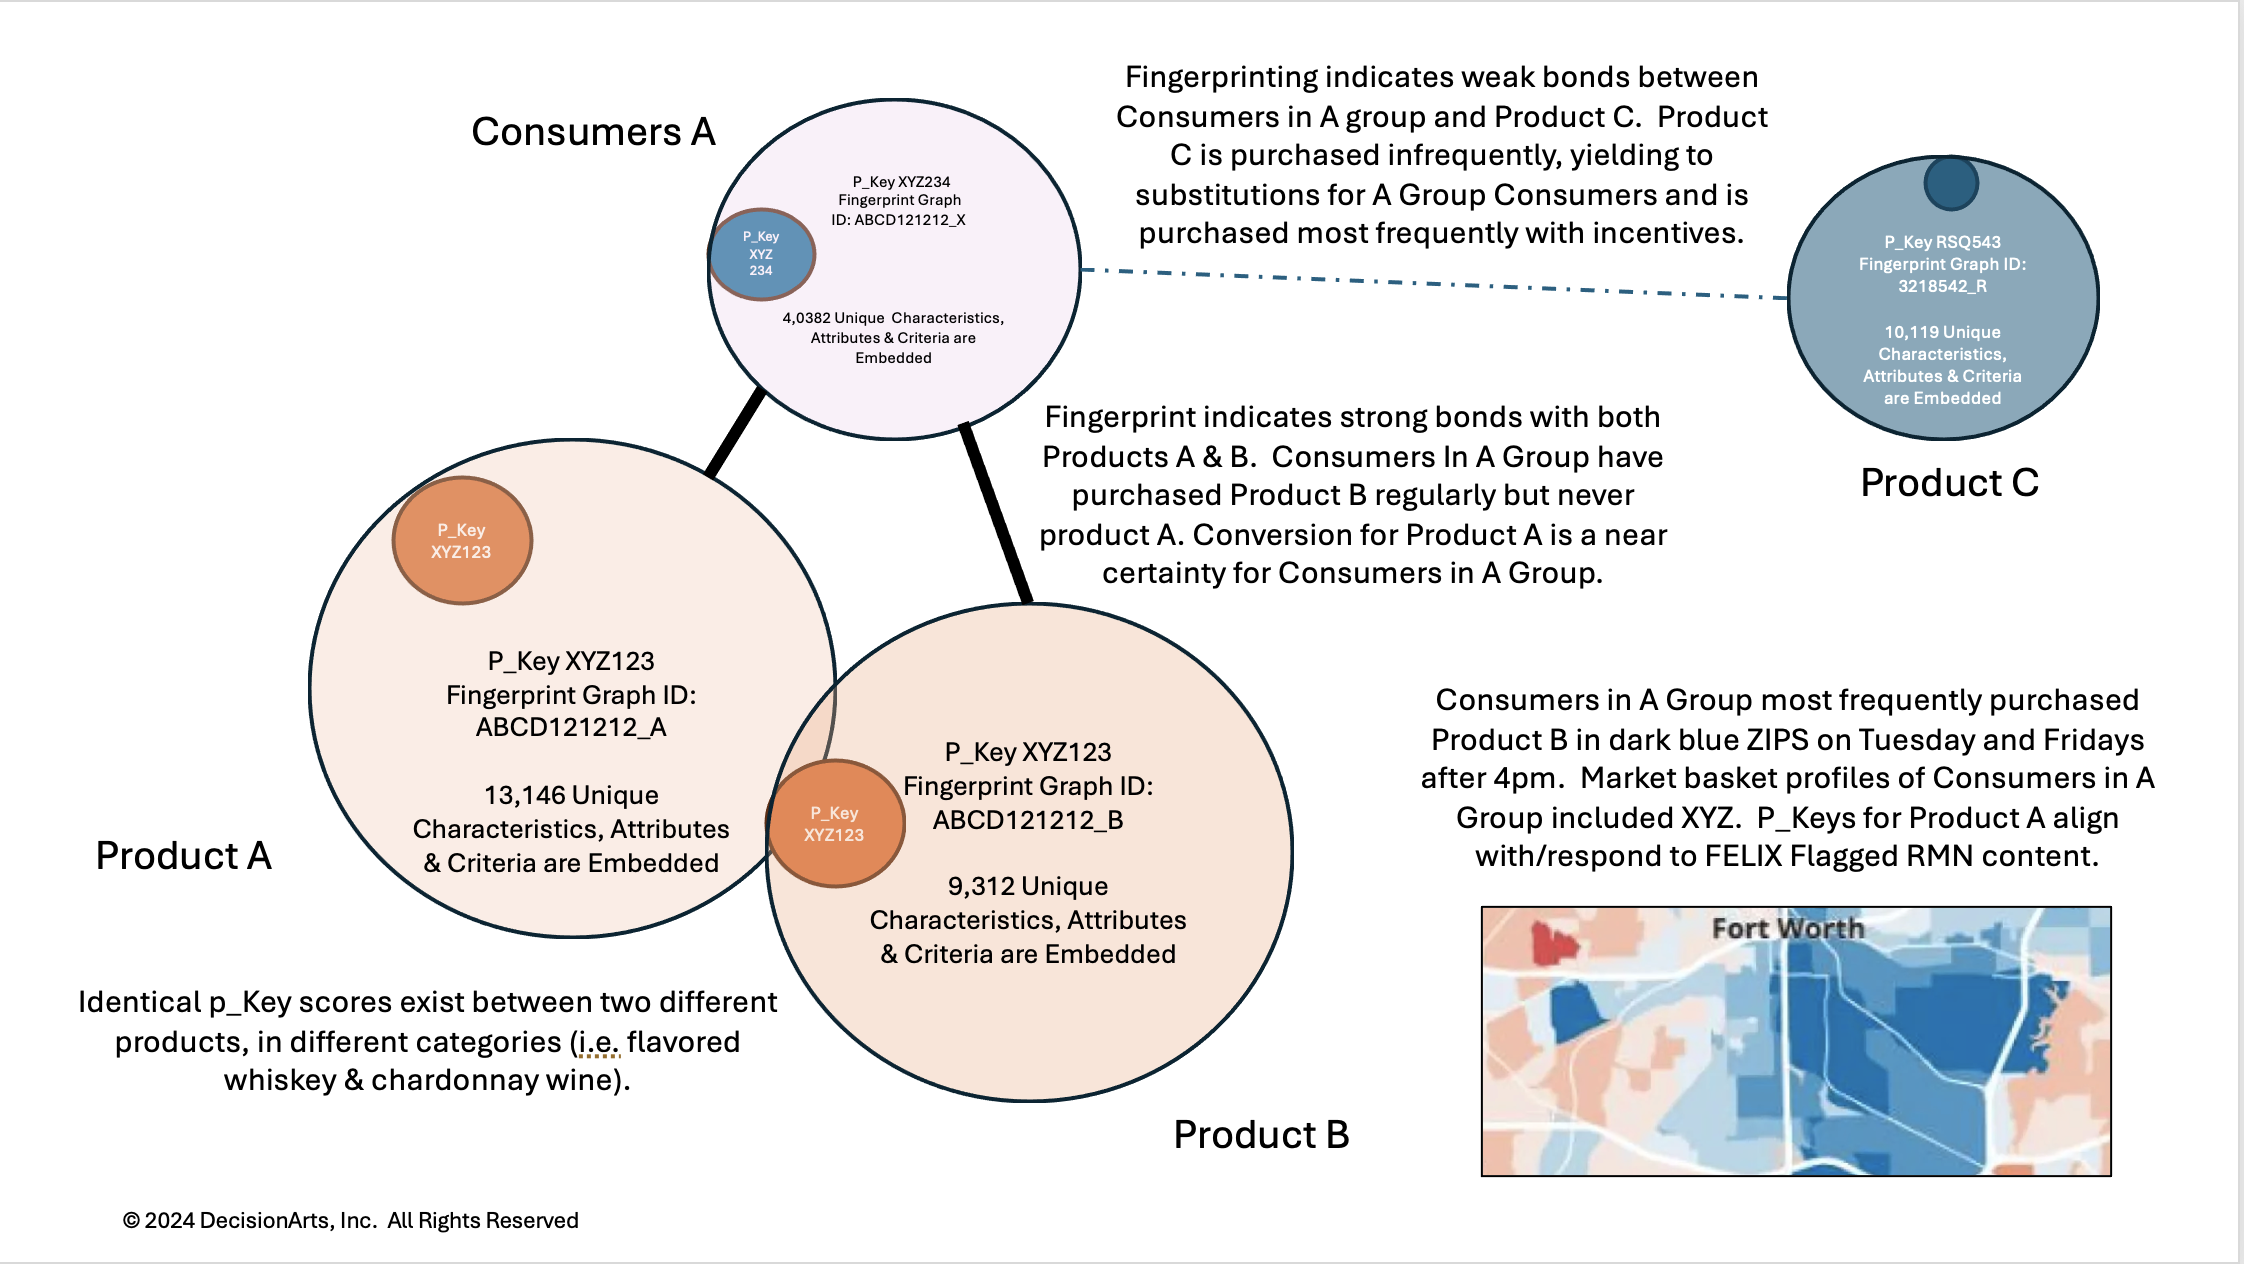
In this instance, FELIX indicated an unmet, high-volume demand with a 10%+ CAGR that was outside of the demand category that all other brands were competing for.
The p_Key is a unique, highly precise identifying address in FELIX’s knowledge graph, see it at work in this simple explainer video) and is core to the Fingerprinting process FELIX utilizes.
This is what happened
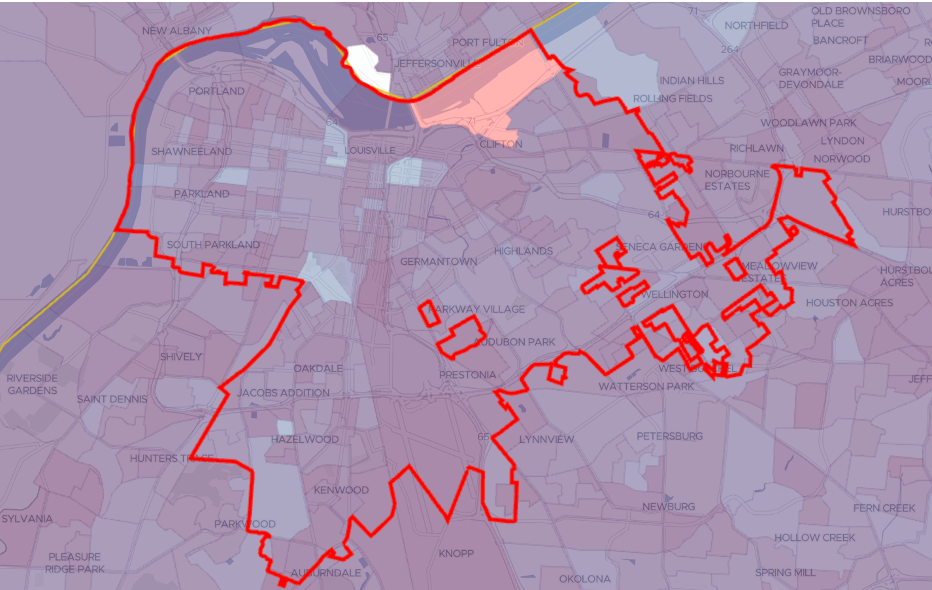
When the new Mac & Cheese was merchandised in both stores within the identified ZIP codes that fingerprinting illuminated as optimal. Mapping allowed to drill down into Fingerprint and strong bond linkage details (product links, frequency and value scores, target customer density and scores, etc.). The product was also monetized in locations which FELIX indicated were less than to not optimal.
This determination was based on the strong bond linkages FELIX identified and which strong bonded products linked to the featured product met certain performance goals. FELIX also provided guidance as to the product performance, by ZIP code indicating optimal product launch and sell through areas, as well as which areas to grow into and to exclude at the outset.
Aisle Performance
In stores where no Fingerprint merchandising was conducted, the new Mac & Cheese was present in just over 1% of market baskets.
In stores where Fingerprint merchandising was conducted and where concentrated consumer profiles patronized, the Mac & Cheese stocked in the aisle, in the same configuration as non-ID’ed stores was present in just over 3% of market baskets.
Merchandising Performance
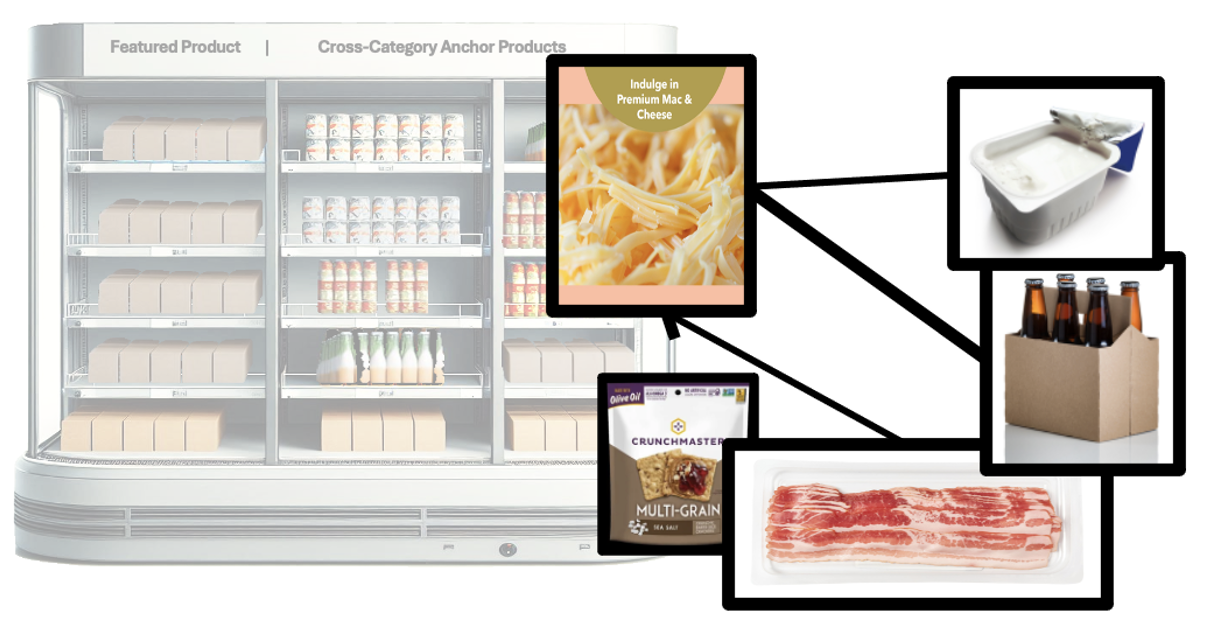
A four-shelf refrigerated endcap was stocked with all four Mac & Cheese SKU’s but each SKU was aligned with a series of cross category products the Mac & Cheese had strong bonds with. These ‘anchor products’ sold well with the consumer segments identified through fingerprinting. The targeted consumers, the anchor products and the featured products all had overlapping fingerprints. Fingerprinting also identified certain traits which were linked to messaging receptivity, which in turn drove a specific merchandising message.
What were the Anchor Product Categories?
· IPA Beer (specific brands/flavor profiles were ID’ed)
· Smoked thick cut bacon (specific brands and price points were ID’ed)
· Two flavors of cheese spread (specific brands and flavor profiles were ID’ed)
· Artisanal seasoned crackers (brands, specific flavor profiles, ingredients and price points were ID’ed)
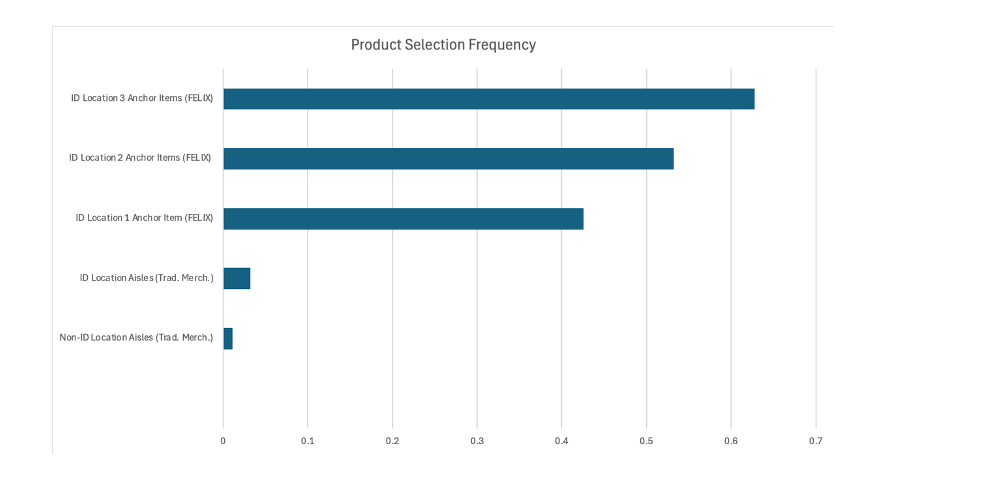
· The Featured Product was consistently included in 43% of the identified consumer group baskets when 1 anchor product was present and selected from end cap on average.
· The Featured Product was consistently included in 53% of the identified consumer group customer baskets when 2 anchor products were present and selected from end cap on average.
· The Featured Product was consistently included in 63% of consumer group baskets when 3 or more anchor products were present and selected from end cap on average.
What was required?
· Retailers were provided an end-cap schematic to follow
· Merchandising was created and paid for using existing processes and resources
· Shelf planograms were retained
· No new slotting allocations/fees were required
· No specialty redemption methods had to be created
· No new enterprise level hardware (BTLE, Computer Vision) required
· No new retailer, distributor or brand inventory management functions required
· No specialty pricing required, POS or inventory management integration required
· Maintain traditional collaboration methods between brand team and retail team
· An appetite to increase revenue and EBIDA (brand and retailer)
· A willingness to evolve (only slightly)
· A desire to try something outside of the status quo
· A willingness to trust hard data
· An understanding that all AI is not the same, one size does not fit all
· A believe that the right AI solution is a tool (like Night Vision Goggles are simply a tool) to help you see something previously invisible, rather than some magic silver bullet that will displace everyone and do everything.
To learn more or to set up a discussion on how FELIX might apply to your business, please reach out at: hello@decisionarts.io
Click here to visit DecisionArts Click here to learn how FELIX works